Line © OpenStreetMap contributors (ODbL), checked by Global Adventurer.
The hike
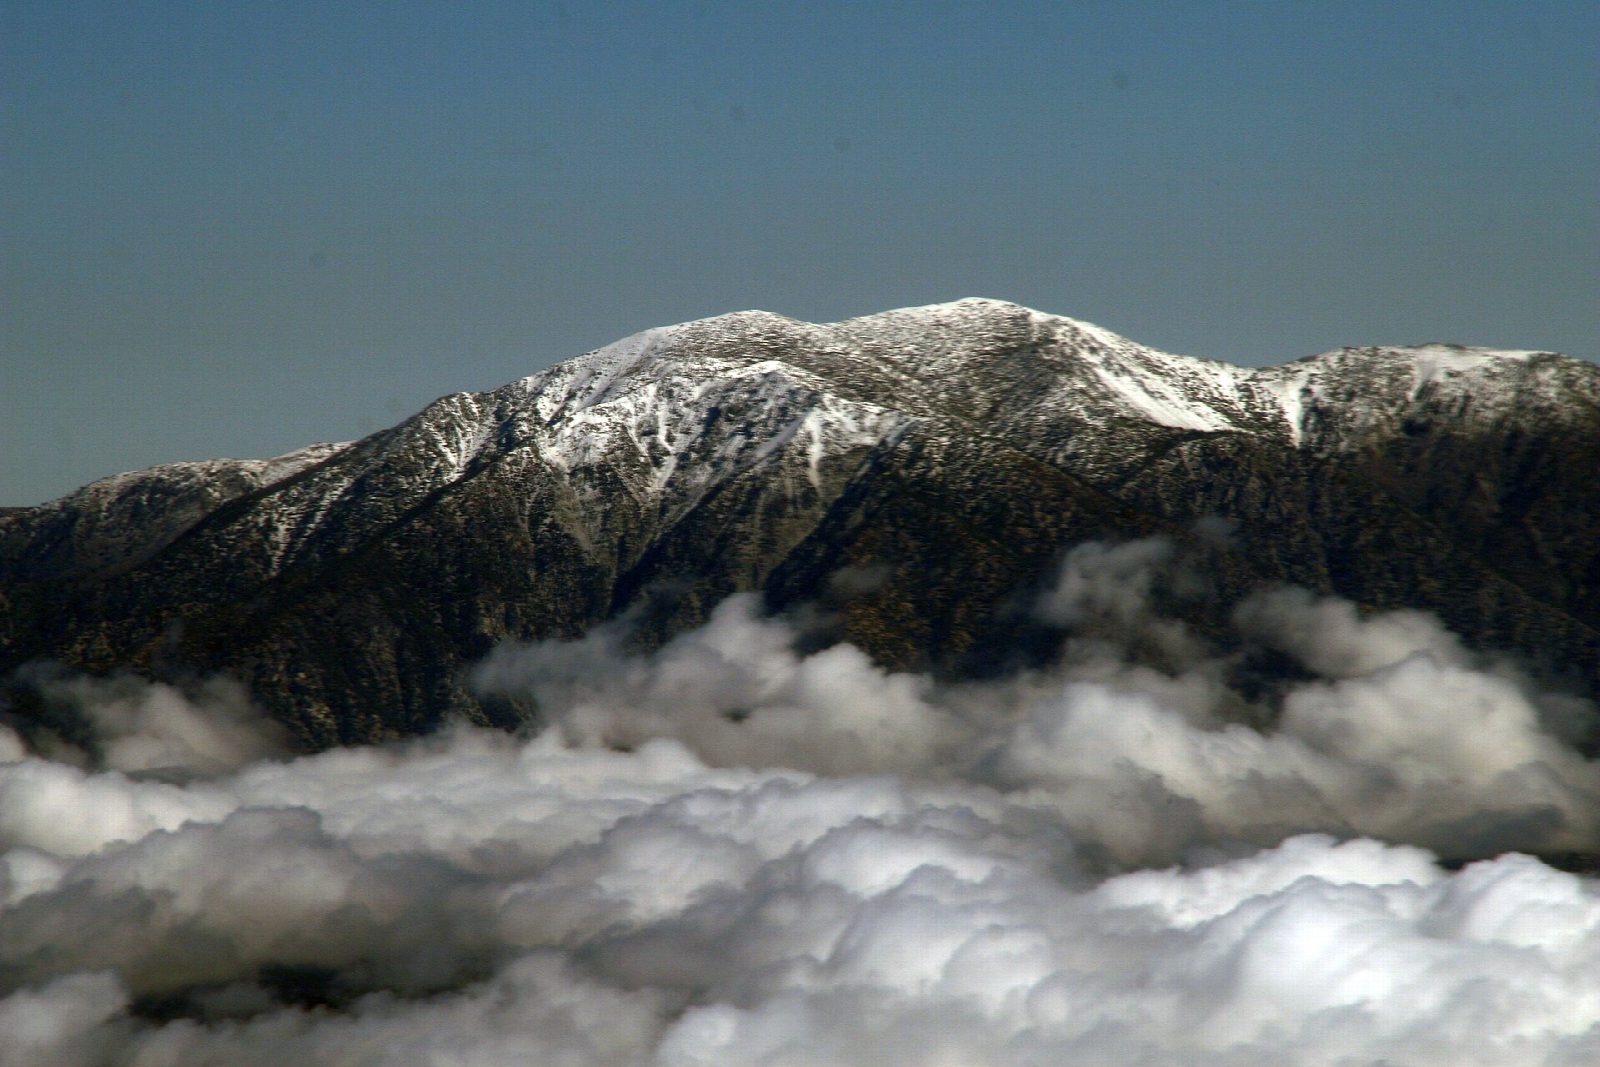
The walk starts at Manker Flat, on Mount Baldy Road; park beside the road by the gate of Falls Road. Walk up Falls Road to the hairpin below San Antonio Falls, where a short path leads to the foot of the falls. The road turns to dirt, and soon the Baldy Bowl Trail leaves it on the left. It climbs steeply to the San Antonio Ski Hut, crosses the foot of Baldy Bowl and climbs the ridge to the bare summit, just over 10,000 feet up. Go down east by the Devil's Backbone, a narrow ridge with drops on both sides, to the top of the ski lifts and Baldy Notch. From the Notch the fire road winds down past the falls to Manker Flat.
It is a 10.3-mile (16.6 km) loop with 3,800 feet (1,158 m) of climbing; allow about 8½ hours. The grade is Strenuous: a very big climb, steep and loose, to a high, exposed summit.
In winter and spring the upper mountain is hard snow and ice. People die in falls here most winters, and the Forest Service closed these trails for weeks early in 2026. Go only when the route is free of snow, unless you have an ice axe and crampons and can use them. Carry all your water.
Cars parked at Manker Flat need an Adventure Pass or an America the Beautiful pass.
Route drawn by Global Adventurer along OpenStreetMap paths (© OpenStreetMap contributors, ODbL), with figures worked out from it. Check the forecast and the ground on the day: paths change.
Good to know
- Up past San Antonio Falls and the Ski Hut, down the narrow Devil's Backbone
- In winter the upper slopes are icy and people die in falls: axe and crampons skills needed
- An Adventure Pass or interagency pass is needed to park at Manker Flat
Summits on the way
- Mount San Antonio 10,066 ft (3,068 m)
Getting there
Start: Manker Flat. 34.26567, -117.62725
Places to stay nearby
Rooms in and around Southern California: Booking.com → Expedia →
Affiliate links: if you book, Global Adventurer earns a small commission at no cost to you.
Paths change, and the weather decides the day. The line and figures come from OpenStreetMap and our own checks; take a map, check the forecast, and turn back if it isn't right.